Sampling (signal processing)
In signal processing, sampling is the reduction of a continuous signal to a discrete signal. A common example is the conversion of a sound wave (a continuous-time signal) to a sequence of samples (a discrete-time signal).
A sample refers to a value or set of values at a point in time and/or space.
A sampler is a subsystem or operation that extracts samples from a continuous signal. A theoretical ideal sampler produces samples equivalent to the instantaneous value of the continuous signal at the desired points.
Contents |
Theory
- See also: Nyquist–Shannon sampling theorem
For convenience, we will discuss signals which vary with time. However, the same results can be applied to signals varying in space or in any other dimension and similar results are obtained in two or more dimensions.
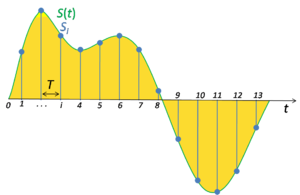
Let x(t) be a continuous signal which is to be sampled, and that sampling is performed by measuring the value of the continuous signal every T seconds, which is called the sampling interval. Thus, the sampled signal x[n] given by:
- x[n] = x(nT), with n = 0, 1, 2, 3, ...
The sampling frequency or sampling rate fs is defined as the number of samples obtained in one second, or fs = 1/T. The sampling rate is measured in hertz or in samples per second.
We can now ask: under what circumstances is it possible to reconstruct the original signal completely and exactly (perfect reconstruction)?
A partial answer is provided by the Nyquist–Shannon sampling theorem, which provides a sufficient (but not always necessary) condition under which perfect reconstruction is possible. The sampling theorem guarantees that bandlimited signals (i.e., signals which have a maximum frequency) can be reconstructed perfectly from their sampled version, if the sampling rate is more than twice the maximum frequency. Reconstruction in this case can be achieved using the Whittaker–Shannon interpolation formula.
The frequency equal to one-half of the sampling rate is therefore a bound on the highest frequency that can be unambiguously represented by the sampled signal. This frequency (half the sampling rate) is called the Nyquist frequency of the sampling system. Frequencies above the Nyquist frequency fN can be observed in the sampled signal, but their frequency is ambiguous. That is, a frequency component with frequency f cannot be distinguished from other components with frequencies NfN + f and NfN – f for nonzero integers N. This ambiguity is called aliasing. To handle this problem as gracefully as possible, most analog signals are filtered with an anti-aliasing filter (usually a low-pass filter with cutoff near the Nyquist frequency) before conversion to the sampled discrete representation.
Observation period
The observation period is the span of time during which a series of data samples are collected at regular intervals. More broadly, it can refer to any specific period during which a set of data points is gathered, regardless of whether or not the data is periodic in nature. Thus a researcher might study the incidence of earthquakes and tsunamis over a particular time period, such as a year or a century.
The observation period is simply the span of time during which the data is studied, regardless of whether data so gathered represents a set of discrete events having arbitrary timing within the interval, or whether the samples are explicitly bound to specified sub-intervals.
Practical implications
In practice, the continuous signal is sampled using an analog-to-digital converter (ADC), a non-ideal device with various physical limitations. This results in deviations from the theoretically perfect reconstruction capabilities, collectively referred to as distortion.
Various types of distortion can occur, including:
- Aliasing. A precondition of the sampling theorem is that the signal be bandlimited. However, in practice, no time-limited signal can be bandlimited. Since signals of interest are almost always time-limited (e.g., at most spanning the lifetime of the sampling device in question), it follows that they are not bandlimited. However, by designing a sampler with an appropriate guard band, it is possible to obtain output that is as accurate as necessary.
- Integration effect or aperture effect. This results from the fact that the sample is obtained as a time average within a sampling region, rather than just being equal to the signal value at the sampling instant. The integration effect is readily noticeable in photography when the exposure is too long and creates a blur in the image. An ideal camera would have an exposure time of zero. In a capacitor-based sample and hold circuit, the integration effect is introduced because the capacitor cannot instantly change voltage thus requiring the sample to have non-zero width.
- Jitter or deviation from the precise sample timing intervals.
- Noise, including thermal sensor noise, analog circuit noise, etc.
- Slew rate limit error, caused by an inability for an ADC output value to change sufficiently rapidly.
- Quantization as a consequence of the finite precision of words that represent the converted values.
- Error due to other non-linear effects of the mapping of input voltage to converted output value (in addition to the effects of quantization).
The conventional, practical digital-to-analog converter (DAC) does not output a sequence of dirac impulses (such that, if ideally low-pass filtered, result in the original signal before sampling) but instead output a sequence of piecewise constant values or rectangular pulses. This means that there is an inherent effect of the zero-order hold on the effective frequency response of the DAC resulting in a mild roll-off of gain at the higher frequencies (a 3.9224 dB loss at the Nyquist frequency). This zero-order hold effect is a consequence of the hold action of the DAC and is not due to the sample and hold that might precede a conventional ADC as is often misunderstood. The DAC can also suffer errors from jitter, noise, slewing, and non-linear mapping of input value to output voltage.
Jitter, noise, and quantization are often analyzed by modeling them as random errors added to the sample values. Integration and zero-order hold effects can be analyzed as a form of low-pass filtering. The non-linearities of either ADC or DAC are analyzed by replacing the ideal linear function mapping with a proposed nonlinear function.
Applications
Audio sampling
Sampling rate
When it is necessary to capture audio covering the entire 20–20,000 Hz range of human hearing, such as when recording music or many types of acoustic events, audio waveforms are typically sampled at 44.1 kHz (CD), 48 kHz (professional audio), or 96 kHz. The approximately double-rate requirement is a consequence of the Nyquist theorem.
There has been an industry trend towards sampling rates well beyond the basic requirements; 96 kHz and even 192 kHz are available.[1] This is in contrast with laboratory experiments, which have failed to show that ultrasonic frequencies are audible to human observers; however in some cases ultrasonic sounds do interact with and modulate the audible part of the frequency spectrum (intermodulation distortion). It is noteworthy that intermodulation distortion is not present in the live audio and so it represents an artificial coloration to the live sound.[2]
One advantage of higher sampling rates is that they can relax the low-pass filter design requirements for ADCs and DACs, but with modern oversampling sigma-delta converters this advantage is less important.
Bit depth (quantization)
Audio is typically recorded at 8-, 16-, and 20-bit depth, which yield a theoretical maximum signal to quantization noise ratio (SQNR) for a pure sine wave of, approximately, 49.93 dB, 98.09 dB and 122.17 dB [3]. Eight-bit audio is generally not used due to prominent and inherent quantization noise (low maximum SQNR), although the A-law and u-law 8-bit encodings pack more resolution into 8 bits while increase total harmonic distortion. CD quality audio is recorded at 16-bit. In practice, not many consumer stereos can produce more than about 90 dB of dynamic range, although some can exceed 100 dB. Thermal noise limits the true number of bits that can be used in quantization. Few analog systems have signal to noise ratios (SNR) exceeding 120 dB; consequently, few situations will require more than 20-bit quantization.
For playback and not recording purposes, a proper analysis of typical programme levels throughout an audio system reveals that the capabilities of well-engineered 16-bit material far exceed those of the very best hi-fi systems, with the microphone noise and loudspeaker headroom being the real limiting factors.
Speech sampling
Speech signals, i.e., signals intended to carry only human speech, can usually be sampled at a much lower rate. For most phonemes, almost all of the energy is contained in the 5Hz-4 kHz range, allowing a sampling rate of 8 kHz. This is the sampling rate used by nearly all telephony systems, which use the G.711 sampling and quantization specifications.
Video sampling
Standard-definition television (SDTV) uses either 720 by 480 pixels (US NTSC 525-line) or 704 by 576 pixels (UK PAL 625-line) for the visible picture area.
High-definition television (HDTV) is currently moving towards three standards referred to as 720p (progressive), 1080i (interlaced) and 1080p (progressive, also known as Full-HD) which all 'HD-Ready' sets will be able to display.
Undersampling
When one samples a bandpass signal at a rate lower than the Nyquist rate, the samples are equal to samples of a low-frequency alias of the high-frequency signal; the original signal will still be uniquely represented and recoverable if the spectrum of its alias does not cross over half the sampling rate. Such undersampling is also known as bandpass sampling, harmonic sampling, IF sampling, and direct IF to digital conversion.[4]
See also
- Digitizing
- Kell factor
- Digital signal processing
- Downsampling
- Upsampling
- Oversampling
References
- Matt Pharr and Greg Humphreys, Physically Based Rendering: From Theory to Implementation, Morgan Kaufmann, July 2004. ISBN 0-12-553180-X. The chapter on sampling (available online) is nicely written with diagrams, core theory and code sample.
- Shannon, Claude E., Communications in the presence of noise, Proc. IRE, vol. 37, pp. 10–21, Jan. 1949.
- ↑ Digital Pro Sound
- ↑ http://world.std.com/~griesngr/intermod.ppt
- ↑ MT-001: Taking the Mystery out of the Infamous Formula, "SNR=6.02N + 1.76dB," and Why You Should Care
- ↑ Walt Kester (2003). Mixed-signal and DSP design techniques. Newnes. p. 20. ISBN 9780750676113. http://books.google.com/books?id=G8XyNItpy8AC&pg=PA20.